Cluster Dashboard
The CLUSTER dashboard focuses on replication health and comparative performance across cluster members. To view the cluster dashboard, select a cluster name in the cluster navigator.
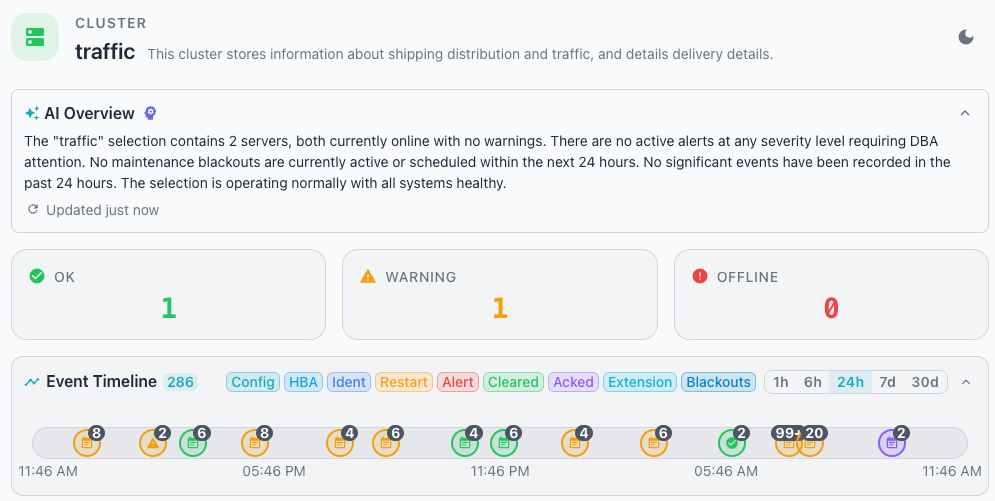
If you have configured AI for your Workbench, the dashboard displays the AI Overview just below the header. The overview provides a concise, AI-powered summary of your object's health, with notes about history and recommended actions to maintain system health.

Tiles below the heading of the CLUSTER dashboard provide an at-a-glance overview of the state of your cluster:

- The
OKtile (green) shows the count of servers that conform to all configured alert thresholds. - The
WARNINGtile (orange) shows the count of servers with one or more active threshold violations. - The
OFFLINEtile (red) shows the count of servers that the collector cannot reach.
Below the status tiles, the Event Timeline displays a timeline with
indicators that show monitored events that have occurred across the monitored
servers. See Event Timeline for details about using
the time range selector, event type filters, and reviewing event details.
Tiles below the event timeline provide a quick glance into the performance of your selected estate, server, or cluster. Hover over a chart or graph to review detailed information about a specific point in time for the selected metric.
The Workbench displays the following tiles:
- The
XID AGEtile shows the transaction ID age for the cluster. - The
CACHE HIT RATIOtile shows the buffer cache hit ratio across the cluster. - The
TRANSACTIONStile shows the transaction rate for the cluster. - The
CHECKPOINTStile shows the checkpoint activity for the cluster.

Reviewing Active Alerts
The Active Alerts pane shows the alerts that are currently active across the
cluster.

See Using Alerts for details on reviewing, acknowledging, and analyzing alerts, and for how to find an alert's acknowledgment reason or a past alert from the Event Timeline.
Reviewing Cluster Topology
The Topology pane renders an interactive diagram showing servers as nodes
with color-coded replication edges. Each edge represents a replication
relationship between two servers.

A colored dot on each node indicates server status; a green dot marks an online server. Each node tile displays a label that identifies the server.
The diagram uses the following color scheme for edges:
- Physical and streaming replication edges display in blue.
- Spock replication edges display in orange.
- Logical replication edges display in green.
Edge labels display the replication type so you can distinguish between different replication methods at a glance.
Monitoring the Cluster
The Monitoring pane presents replication health and comparative performance
data for the cluster.
Reviewing Replication Lag
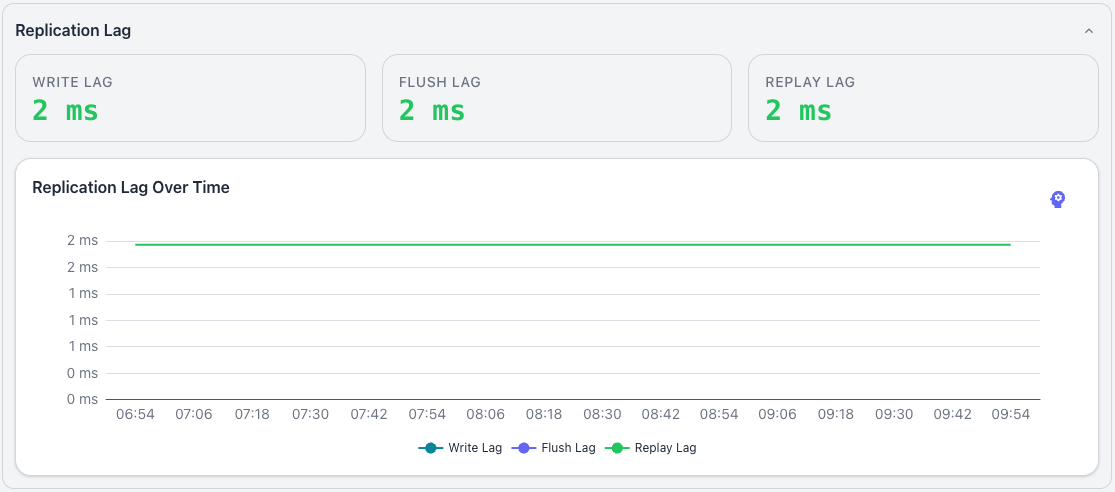
The Replication Lag pane tracks replication lag over the selected time
range for the replication relationships in the cluster. Three tiles at the top
of the panel present the current lag values in milliseconds; a time-series
chart below the tiles plots the same metrics over the selected time range.
The pane displays the following tiles:
- The
WRITE LAGtile shows the current write lag for the cluster in milliseconds. - The
FLUSH LAGtile shows the current flush lag for the cluster in milliseconds. - The
REPLAY LAGtile shows the current replay lag for the cluster in milliseconds.
The Replication Lag Over Time chart plots the write, flush, and replay lag
metrics against a time axis; a legend identifies each line by color and label.
When the Workbench detects no primary server, the graphic displays the message
No primary server detected in this cluster.
Reviewing Comparative Metrics
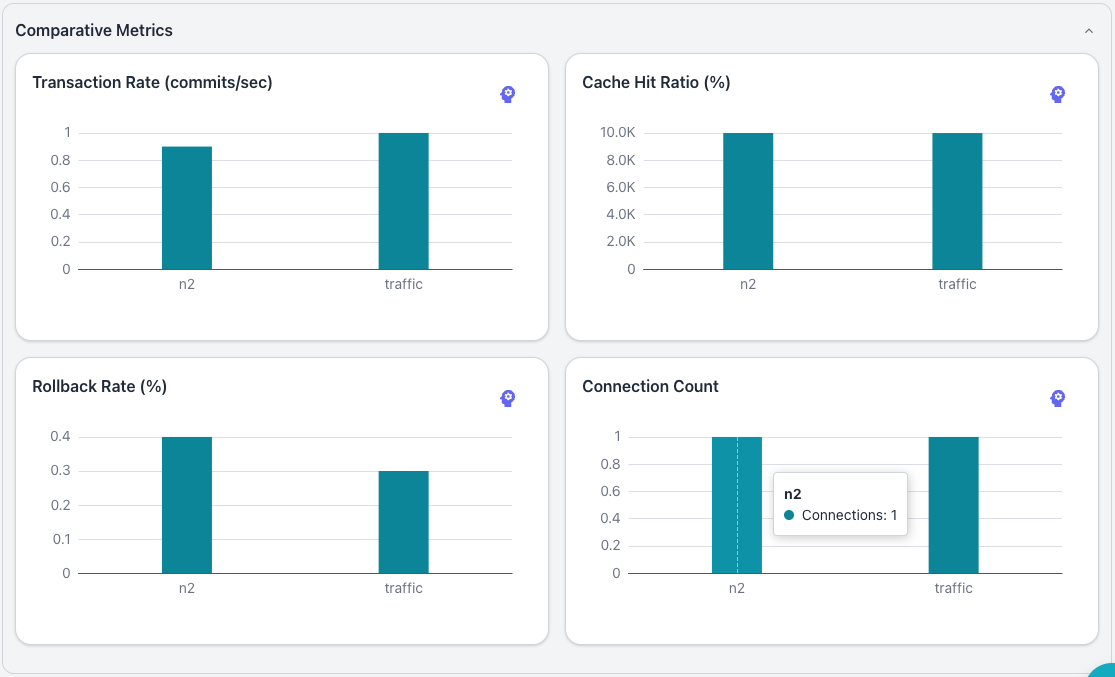
The Comparative Metrics pane presents side-by-side metrics for all servers
in the cluster; use the pane to identify performance disparities between
cluster members. The pane arranges four bar charts in a grid, and each chart
plots one bar per server, labeled by server name along the x-axis.
The pane displays the following charts:
- The
Transaction Rate (commits/sec)chart shows the commit rate for each server in the cluster. - The
Cache Hit Ratio (%)chart shows the buffer cache hit ratio for each server in the cluster. - The
Rollback Rate (%)chart shows the transaction rollback rate for each server in the cluster. - The
Connection Countchart shows the number of connections for each server in the cluster.
Hover over a bar to display a tooltip with the server name and the metric's value for that server. Click a server entry to navigate to the server dashboard for that server.
Reviewing Cluster Settings
Each cluster or cluster node displays a gear icon when you hover
over the object name; click the gear icon to open the Cluster Settings
dialog. The dialog organizes its settings into a horizontal tab bar, and
Cancel and Save buttons at the bottom discard or retain your changes.
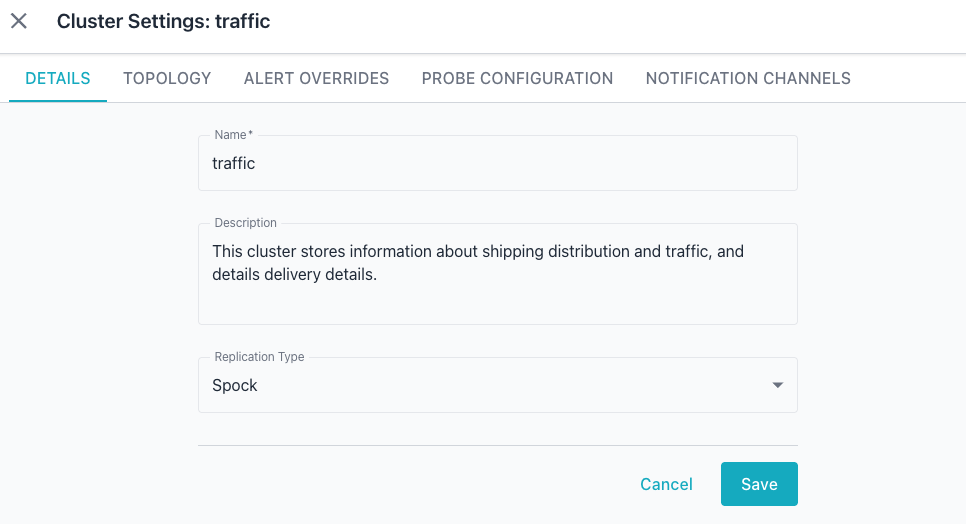
DETAILS Tab
The DETAILS tab presents a form that identifies the cluster and defines its
replication behavior. The tab includes the following fields:
- The
Namefield displays or modifies the display name for the cluster. - The
Descriptionfield is a multi-line text area that holds optional notes about the cluster. - The
Replication Typedropdown specifies the replication technology used for the cluster.
TOPOLOGY Tab
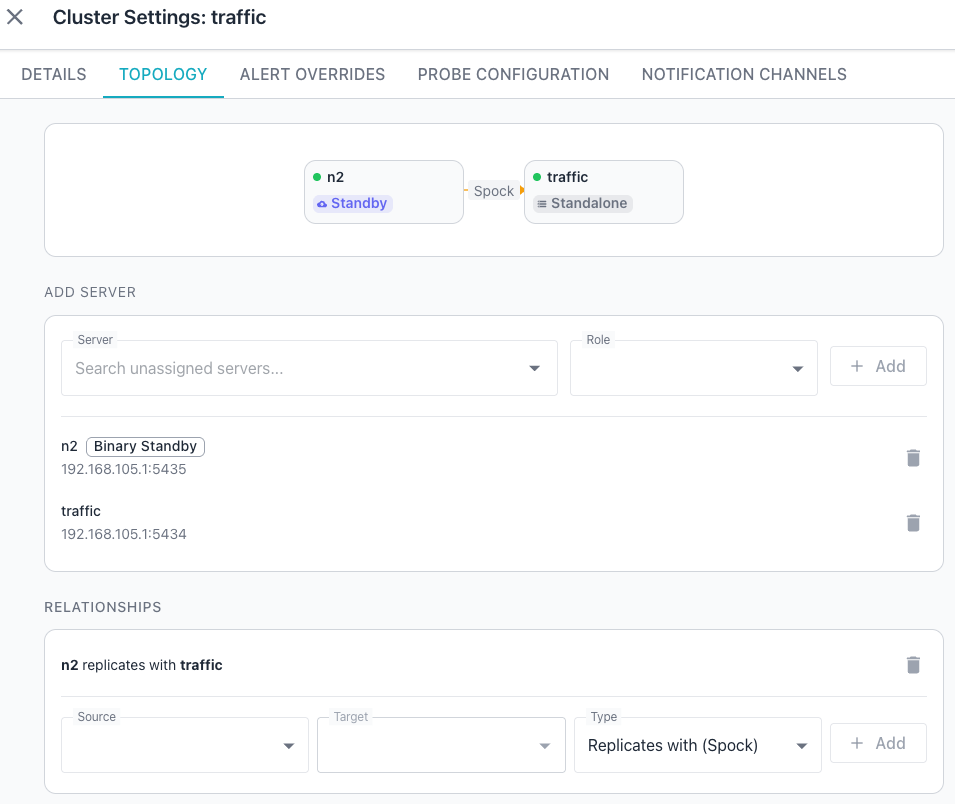
The TOPOLOGY tab presents a visual diagram of the cluster members and lets
you assign servers and define replication relationships. The diagram displays
each member node as a tile with a status dot and a role badge that identifies
the node's role in the cluster.
Use the ADD SERVER section to add a new node to the cluster:
- Use the
Serverdropdown to search for and select an unassigned server. - Use the
Roledropdown to set the role the server will hold in the cluster. - Use the
+ Addbutton to add the selected server to the cluster.
A list of currently assigned servers appears below the ADD SERVER section.
Server details display the server name, a role badge, its host and port, and a
Delete (trash) icon. Select the Delete icon to remove the server from the
cluster.
The RELATIONSHIPS section at the bottom of the tab shows the replication
relationships the topology diagram presents. Use the section's controls to
define a new relationship between two cluster members:
- Use the
Sourcedropdown to select the source node for the relationship. - Use the
Targetdropdown to select the target node for the relationship. - Use the
Typedropdown to select the replication type, such as "Replicates with (Spock)". - Click
+ Addto create the relationship between the selected nodes.
ALERT OVERRIDES Tab
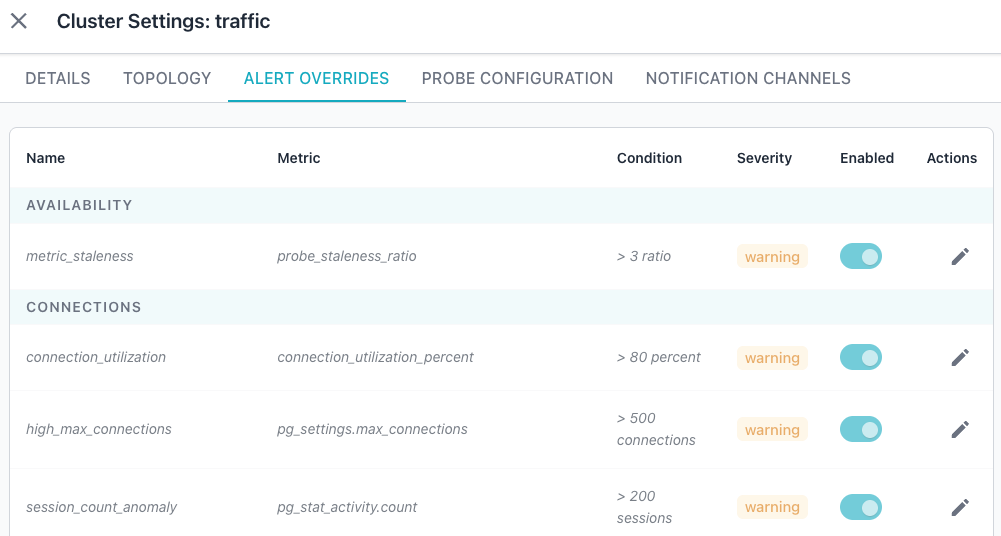
The ALERT OVERRIDES tab lets you tailor the alert rules for the selected
cluster. A table lists the current rules and settings; each row describes one
alert rule and its threshold. The table contains the following columns:
Nameidentifies the alert rule.Metricnames the metric the rule monitors.Conditionspecifies the threshold that triggers the alert.Severityindicates the alert level, such as "warning".Enabledprovides a toggle that activates or deactivates the rule for the selected cluster.Actionsprovides an edit (pencil) icon that opens the rule for adjustment.
The Workbench groups the rows under category headers such as AVAILABILITY,
CONNECTIONS, and LOCKS; additional categories appear as you scroll through
the table. See Alert Rules for the full
list of built-in rules and their default thresholds.
PROBE CONFIGURATION Tab
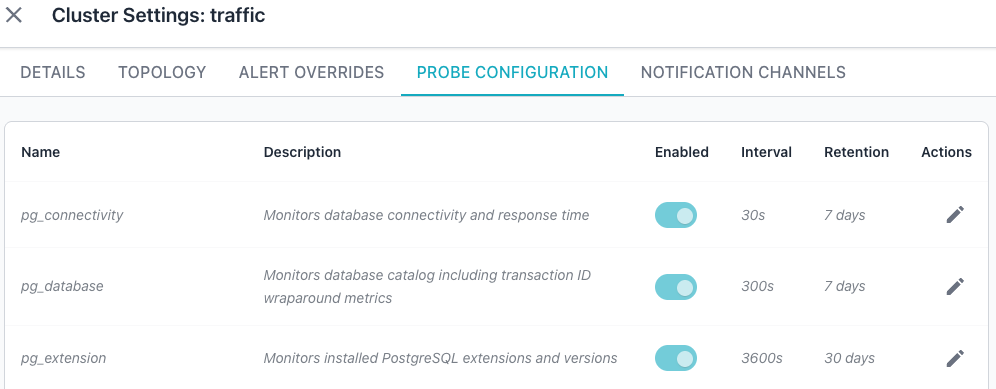
The PROBE CONFIGURATION tab controls the probes that collect metrics for the
selected cluster. A table lists the current probes and their settings; each
row describes one probe and its configuration. The table contains the
following columns:
Nameidentifies the probe.Descriptionexplains what the probe monitors.Enabledprovides a toggle that activates or deactivates the probe for the selected cluster.Intervalspecifies how often the probe collects data, in seconds.Retentionspecifies how long the Workbench retains the probe's collected data.Actionsprovides an edit (pencil) icon that opens the probe for adjustment.
The table scrolls to reveal additional probes below the visible rows. See Probe Management for the full list of built-in probes and their scopes.
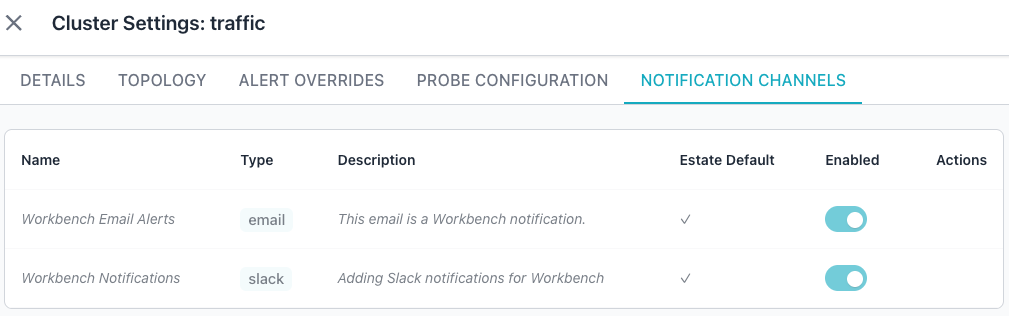
NOTIFICATION CHANNELS Tab
The NOTIFICATION CHANNELS tab manages the channels that deliver alert
notifications for the selected cluster. A table lists the available channels
and their settings; each row describes one channel and its current override
state. The table contains the following columns:
Nameidentifies the notification channel.Typeshows the channel type, such as email, Slack, Mattermost, or webhook.Descriptionshows the channel's optional description.Estate Defaultindicates whether the channel applies to all servers or clusters by default.Enabledprovides a toggle that activates or deactivates the channel for the selected cluster, overriding the estate default.Actionsprovides controls for managing the channel's override for the selected cluster.
If you have not configured any notification channels, the tab displays the empty state "No notification channels found." See Notification Channels for the full list of supported channel types and how to configure them.