Reviewing Workbench Dashboards
Monitoring dashboards provide a hierarchical view of PostgreSQL database health and performance. You can navigate through five levels of detail, from a fleet-wide estate overview down to individual database objects.
Dashboard Hierarchy
The dashboard system organizes metrics into five levels that progress from broad to specific. Select items in the cluster navigator or click drillable elements within each dashboard to move between levels. See Using the Cluster Navigator for details on the navigator tree.
- The ESTATE DASHBOARD shows fleet-wide health across all monitored servers.
- The CLUSTER DASHBOARD focuses on replication topology and comparative metrics across cluster members.
- The SERVER DASHBOARD displays system resources and PostgreSQL performance for a single server.
- The DATABASE DASHBOARD presents table and index leaderboards with vacuum status for one database.
- The OBJECT DASHBOARD provides detailed metrics for a specific table, index, or query.
Using the Workbench with an AI Provider
If you have enabled an AI provider, the
Workbench displays an informational analysis of each dashboard that you visit,
and an Ask Ellie chat assistant for interactive help. See
Using AI Features and Ask Ellie for
details.
Using the Cluster Navigator
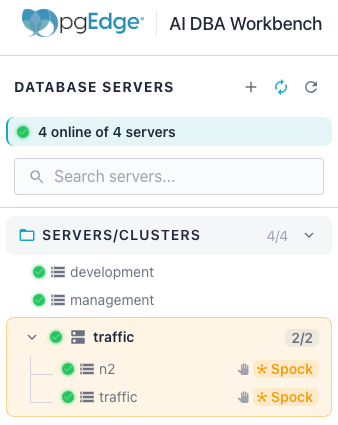
The cluster navigator on the left side of the console provides tree-based navigation across groups, clusters, and individual servers. The navigator tree reflects the estate, cluster, server, and database hierarchy. Select a node in the navigator to view dashboards, alerts, and AI insights for the selected resource.
Expanding and Collapsing Panes
Monitoring dashboards share a set of common UI conventions across their panes. Most panes display a chevron on the right side of the pane heading. Click the chevron to expand or collapse the pane.
Using the Time Range Selector
Many panes include a time range selector that lets you choose the period for the displayed metrics. The selector offers the following ranges:
1hdisplays the last one hour of data.6hdisplays the last six hours of data.24hdisplays the last twenty-four hours of data.7ddisplays the last seven days of data.30ddisplays the last thirty days of data.
This selector is separate from the Event Timeline's own time range selector; see Event Timeline for details on that selector and its event type filters.
Reviewing Server and Cluster Settings
Server nodes and clusters in the cluster navigator each display a gear icon when you hover over them. Click the gear icon to open the settings dialog for that resource. See Server Settings for the server dialog and Cluster Settings for the cluster dialog; each topic covers connection details, cluster topology, alert overrides, probe configuration, and notification channels.