Server Dashboard
The SERVER dashboard provides detailed metrics for a single PostgreSQL server. Select a server node in the cluster navigator to open the dashboard.
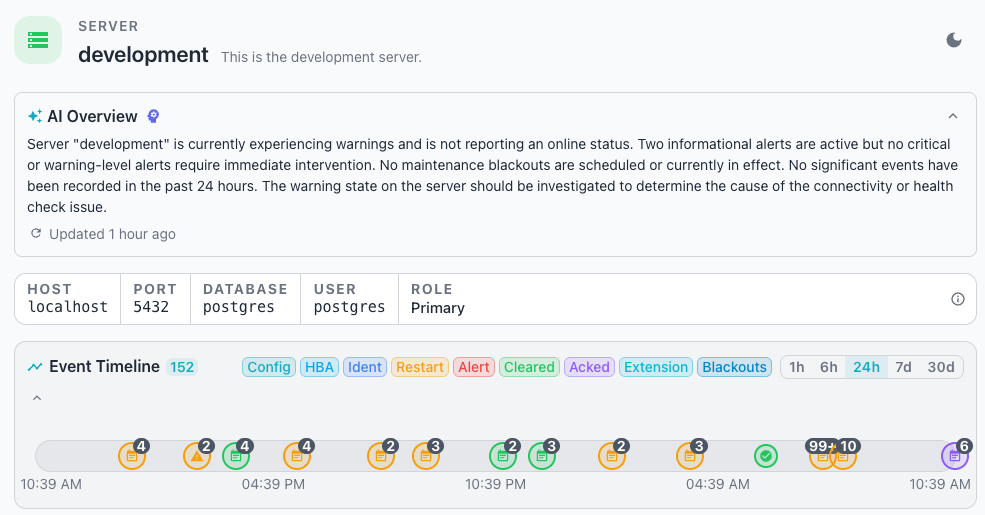
If you have configured AI for your Workbench, the dashboard displays the AI Overview just below the header. The overview provides a concise, AI-powered summary of your server's health, with notes about history and recommended actions to maintain system health.

Below the AI Overview, a bar displays the connection properties used to connect to the server:

The bar displays the following connection details:
- The
HOSTfield shows the network address of the server. - The
PORTfield shows the port on which the server listens. - The
DATABASEfield shows the database used for the connection. - The
USERfield shows the user account used for the connection. - The
ROLEfield shows the server's replication role, such asPrimary.
Select the info icon (the small i at the right of the pane) to open an
expanded information pane that details:
- The header includes the server name after the
Server Information:heading. -
The
POSTGRESQLsection includes:- The PostgreSQL version.
- The
datadirectory location. - The values currently assigned to the
max_connections,max_wal_senders, andmax_replication_slotsparameters.
-
The
DATABASESsection includes details about each database that resides on the server; the information includes the database name, size, and the installed extensions and versions. -
The
CONFIGURATIONsection provides the current settings of a number of parameters commonly used when tuning a database.
Below the status tiles, the Event Timeline displays a timeline with
indicators that show monitored events that have occurred across the monitored
servers. See Event Timeline for details about using
the time range selector, event type filters, and reviewing event details.

Hover over an event on the timeline to retrieve details about a point-in-time on the bar.
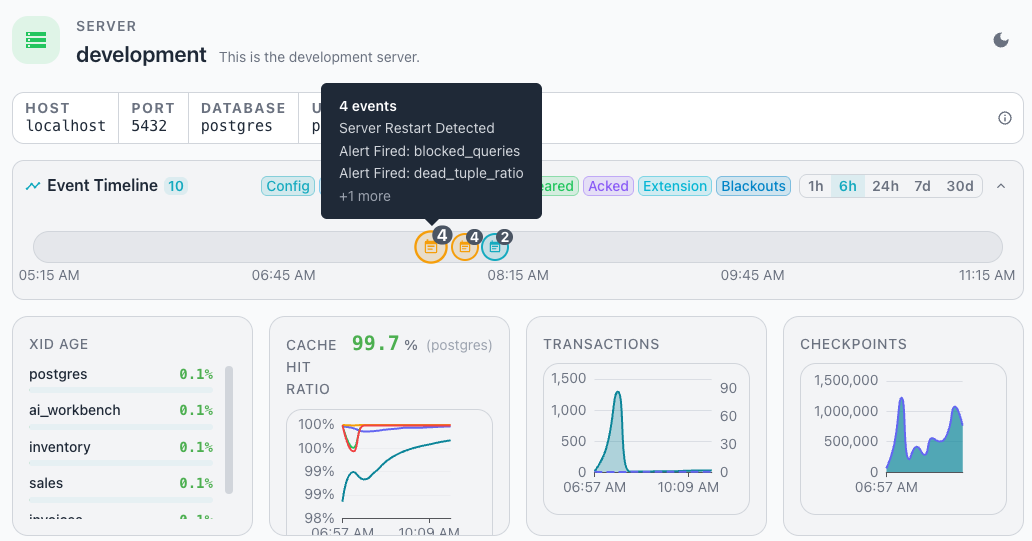
The Key Performance Indicator tiles sit below the event timeline and
summarize performance metrics for the selected server in charts and graphs.

The Workbench displays the following tiles:
- The
XID AGEtile shows the transaction ID age for the server. - The
CACHE HIT RATIOtile shows the buffer cache hit ratio for the server. - The
TRANSACTIONStile shows the transaction rate for the server. - The
CHECKPOINTStile shows the checkpoint activity for the server.
Highlight a point in time on a graph to display the graphed metrics at the selected time in a tooltip, or select the brain icon to perform an analysis of the graph.
The Active Alerts Pane
The Active Alerts pane shows the alerts that are currently active for the
server.
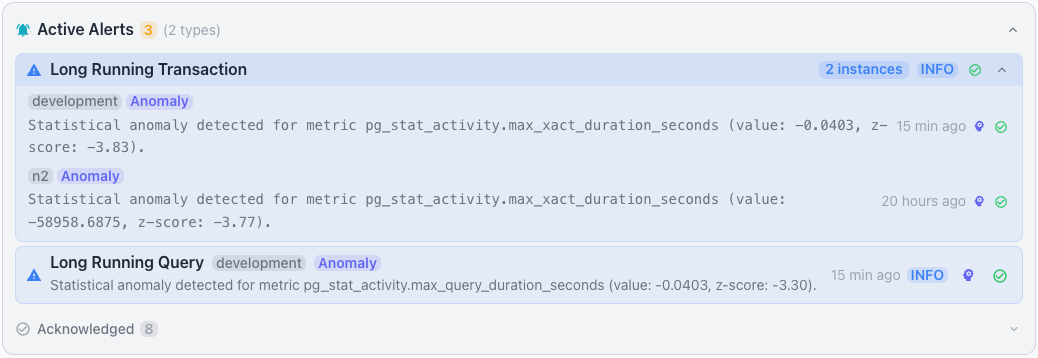
See Using Alerts for details on reviewing, acknowledging, and analyzing alerts, and for how to find an alert's acknowledgment reason or a past alert from the Event Timeline.
The Monitoring Pane
The Monitoring pane presents detailed performance data for the selected
server; collapsible sub-panes group related metrics.
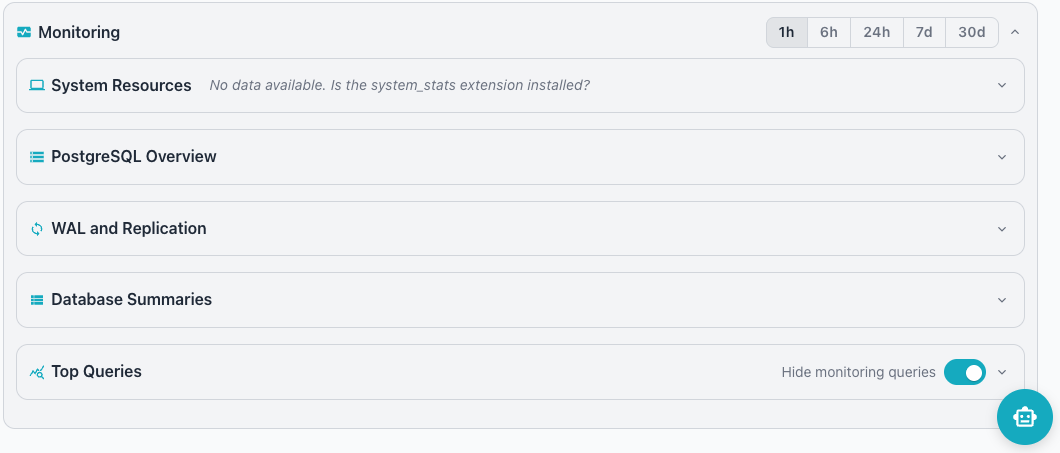
Reviewing System Resources
The System Resources pane displays operating-system metrics for the host
that runs the server. Four tiles summarize current resource usage, and each
tile displays -- when no data is available.
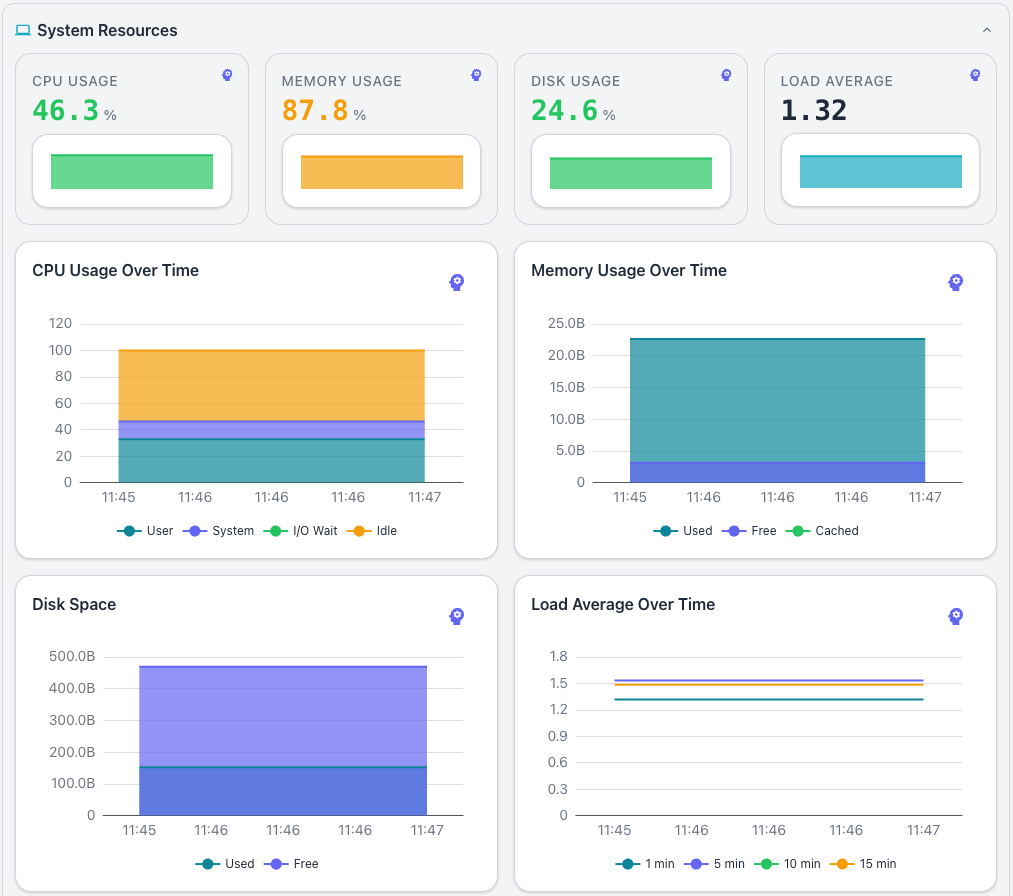
The pane includes the following tiles:
- The
CPU USAGEtile shows the current processor utilization as a percentage. - The
MEMORY USAGEtile shows the current memory utilization as a percentage. - The
DISK USAGEtile shows the current disk utilization as a percentage. - The
LOAD AVERAGEtile shows the current system load average.
Highlight a point on a bar graph for detailed metric about the point-in-time, or select the brain icon to perform an in-depth analysis.
The pane also displays the following time-series charts and graphs:
- The
CPU Usage Over Timechart tracks processor utilization over the selected range. - The
Memory Usage Over Timechart tracks memory utilization over the selected range. - The
Disk Spacechart tracks disk consumption over the selected range. - The
Load Average Over Timechart tracks the system load average over the selected range. - The
Network I/Ochart tracks network throughput over the selected range.
When no data is available, each chart displays a message such as
No CPU data available. Is the system_stats extension installed? The charts
require the system_stats extension to collect operating-system metrics.
Reviewing the PostgreSQL Overview
The PostgreSQL Overview pane displays server-level database metrics. Four
tiles summarize current database activity, and each tile displays -- when no
data is available.
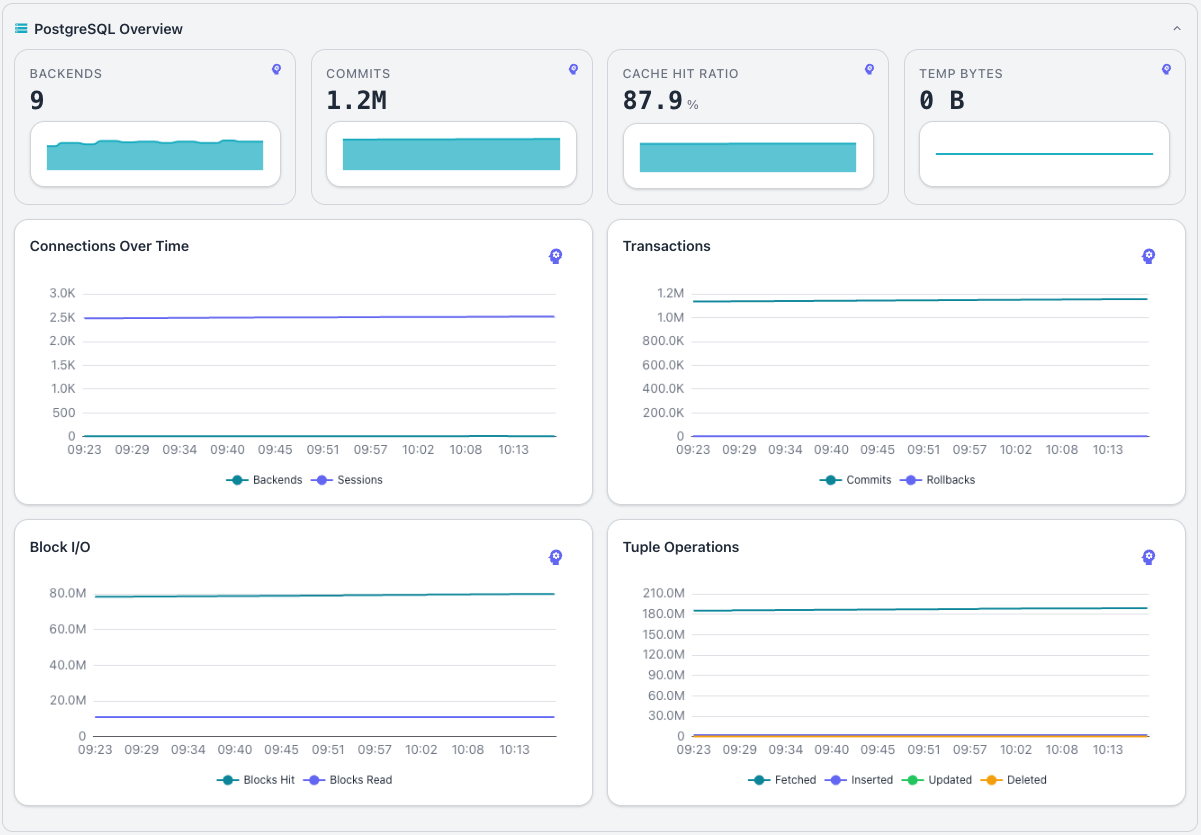
The pane includes the following tiles:
- The
BACKENDStile shows the number of active backend connections. - The
COMMITStile shows the transaction commit rate for the server. - The
CACHE HIT RATIOtile shows the buffer cache hit ratio for the server. - The
TEMP BYTEStile shows the volume of temporary file data written.
The pane also displays the following time-series charts:
- The
Connections Over Timechart tracks active connections over the selected range. - The
Transactionschart tracks the transaction rate over the selected range. - The
Block I/Ochart tracks block read and write activity over the selected range. - The
Tuple Operationschart tracks tuple-level activity over the selected range.
When no data is available, each chart displays a message such as
No connection data available, No transaction data available,
No block I/O data available, or No tuple operation data available.
Reviewing WAL and Replication Activity
The WAL and Replication pane displays write-ahead log activity and
replication status for the server. Four tiles summarize current WAL and
replication activity, and each tile displays -- when no data is available.
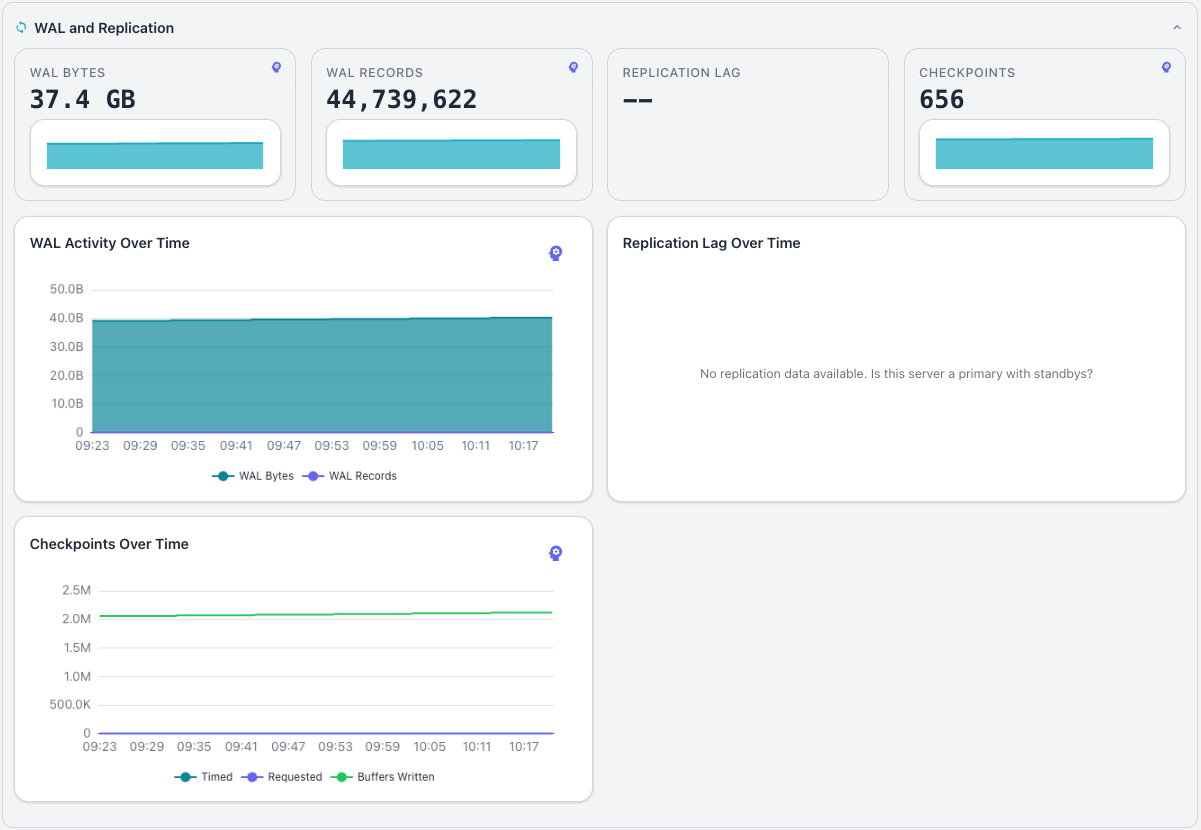
The pane includes the following tiles:
- The
WAL BYTEStile shows the volume of write-ahead log data generated. - The
WAL RECORDStile shows the number of write-ahead log records generated. - The
REPLICATION LAGtile shows the current replication lag for the server. - The
CHECKPOINTStile shows the checkpoint activity for the server.
The pane also displays the following time-series charts:
- The
WAL Activity Over Timechart tracks write-ahead log generation over the selected range. - The
Replication Lag Over Timechart tracks replication lag over the selected range. - The
Checkpoints Over Timechart tracks checkpoint activity over the selected range.
When no data is available, each chart displays a message such as
No WAL data available,
No replication data available. Is this server a primary with standbys?, or
No checkpoint data available.
Reviewing Database Summaries
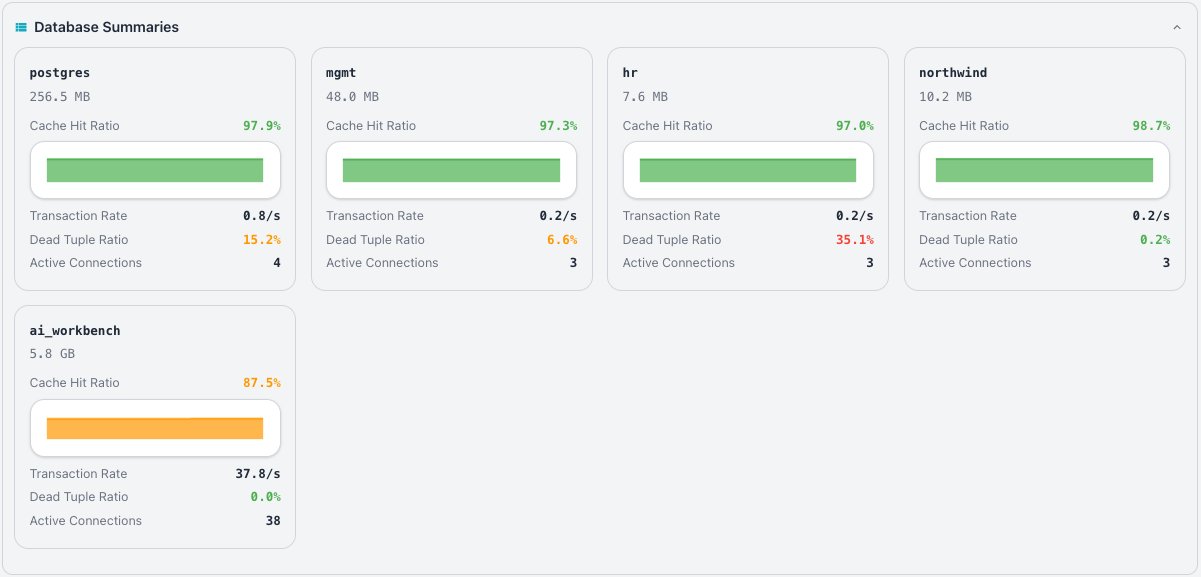
The Database Summaries pane lists all databases on the server with high-level
metrics for each database. Click a database tile to navigate to the
database dashboard for that database.
Top Queries
The Top Queries pane ranks queries by resource consumption. The pane displays
execution time, call count, rows returned, and source database for the most
active queries.
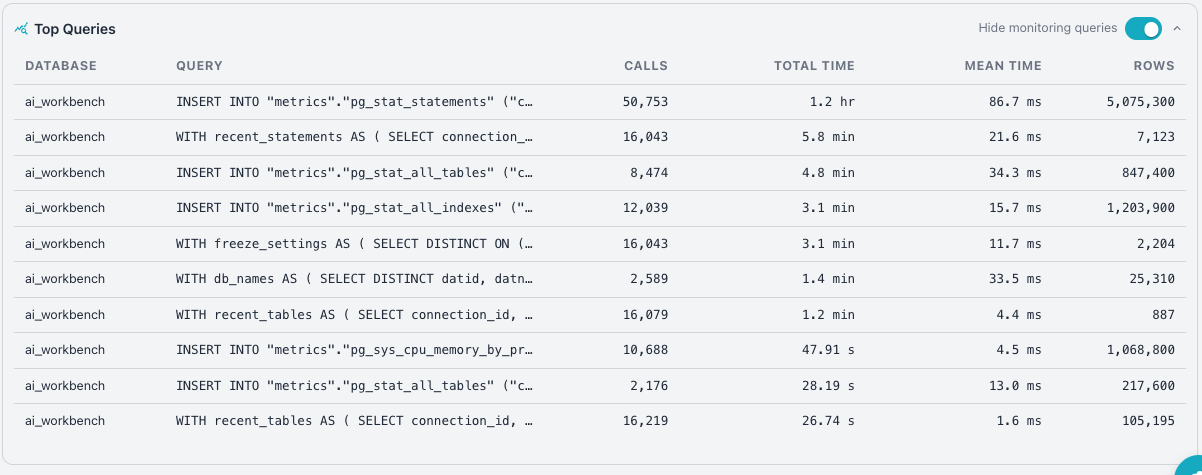
The Database column resolves each query's source database from the dbid field
in pg_stat_statements using pg_stat_activity. Because pg_stat_statements
collects data cluster-wide, the pane deduplicates queries so each entry
reflects a single database context.
The Hide monitoring queries toggle filters out the Workbench's own monitoring
queries from the list. The toggle is on by default to focus on application
queries.
Reviewing Server Settings
Each server node in the cluster navigator displays a gear icon when you
hover over the node; click the gear icon to open the Server Settings
dialog. The dialog organizes its settings into a horizontal tab bar, and
Cancel and Save buttons at the bottom discard or retain your changes.
DETAILS Tab
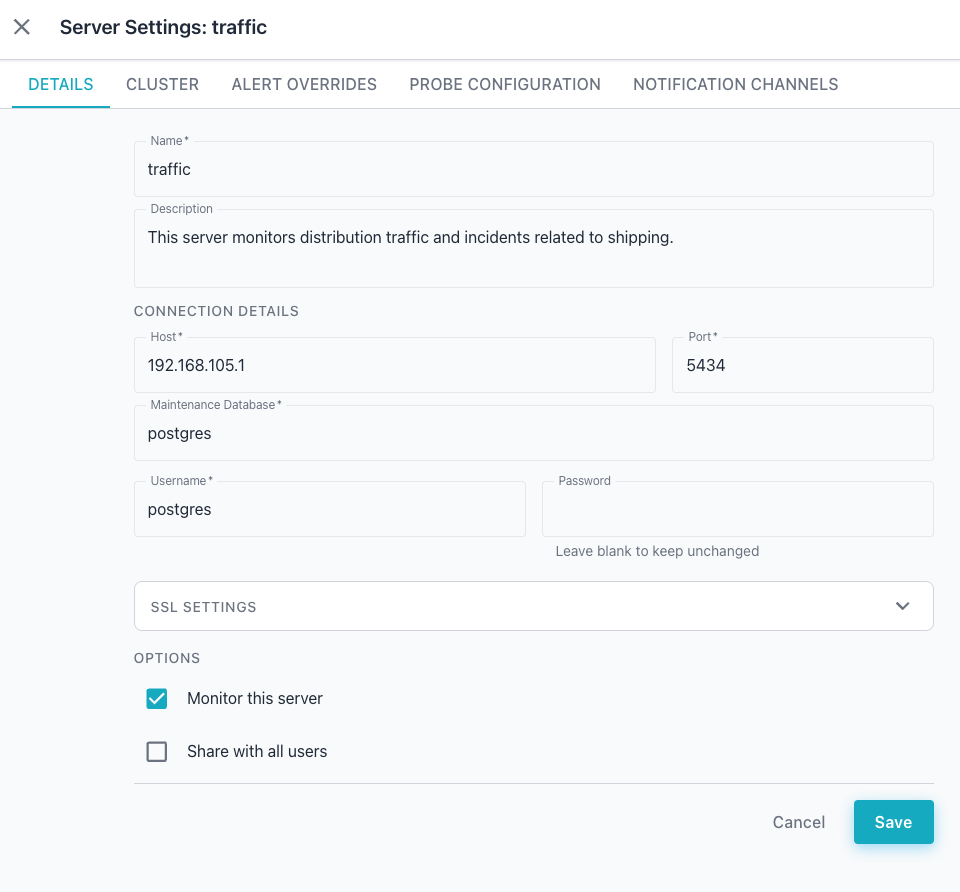
The DETAILS tab presents a form that defines how the Workbench identifies
and connects to the server. The Name field is required and sets the display
name for the server. The Description field is a multi-line text area that
holds optional notes about the server.
The CONNECTION DETAILS subsection specifies how the collector reaches the
database. The subsection includes the following fields:
- The
Host,Port,Maintenance Database, andUsernamefields specify the connection values for the selected server; all values are required. - The
Passwordis optional; leave the field blank to keep the stored password unchanged, or enter a new password to replace it.
A collapsible SSL SETTINGS section appears below the connection fields and
remains collapsed by default. Expand this section to configure encrypted
connection options.
The OPTIONS subsection includes two checkboxes:
- The
Monitor this servercheckbox controls whether the collector gathers metrics from the server. - The
Share with all userscheckbox makes the server visible to every user of the Workbench.
CLUSTER Tab
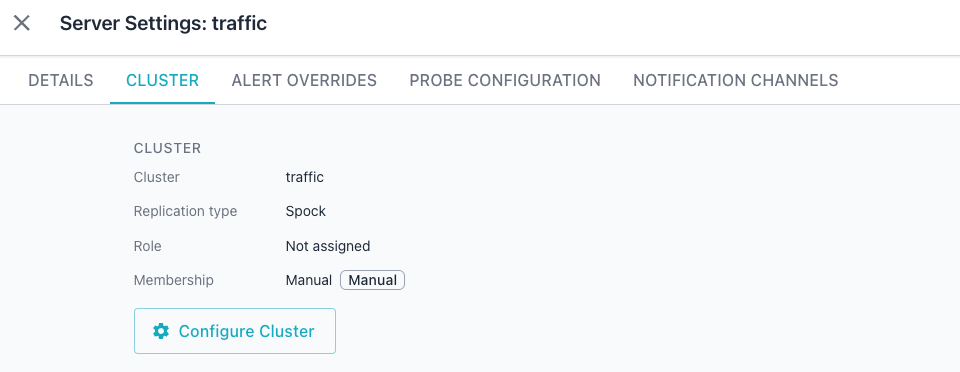
The CLUSTER tab shows the server's current cluster assignment and role. The
tab displays the following fields:
- The
Clusterfield shows the name of the cluster the server belongs to, such as "traffic". - The
Replication Typefield shows the replication technology used by the cluster, such as "Spock". - The
Rolefield shows the server's role within the cluster, or "Not assigned" when the server has no assigned role. - The
Membershipfield shows how the server joined the cluster, such as "Manual", alongside a badge that repeats the membership type.
Click the Configure Cluster button to open the cluster configuration dialog
and manage the server's cluster membership.
ALERT OVERRIDES Tab
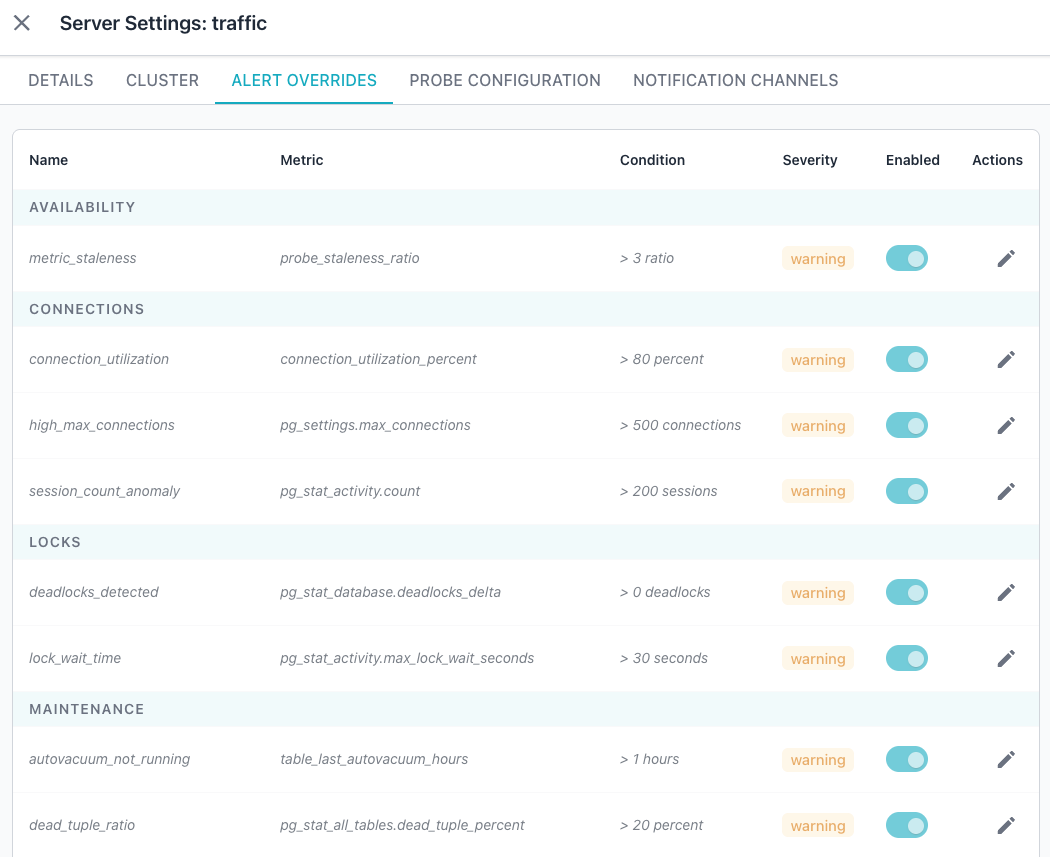
The ALERT OVERRIDES tab lets you tailor the alert rules for the selected
server. A table lists the current rules and settings; each row describes one
alert rule and its threshold. The table contains the following columns:
Nameidentifies the alert rule.Metricnames the metric the rule monitors.Conditionspecifies the threshold that triggers the alert.Severityindicates the alert level, such as "warning".Enabledprovides a toggle that activates or deactivates the rule for the selected server.Actionsprovides an edit (pencil) icon that opens the rule for adjustment.
The Workbench groups the rows under category headers such as AVAILABILITY,
CONNECTIONS, and LOCKS; additional categories appear as you scroll through
the table. See Alert Rules for the full
list of built-in rules and their default thresholds.
PROBE CONFIGURATION Tab
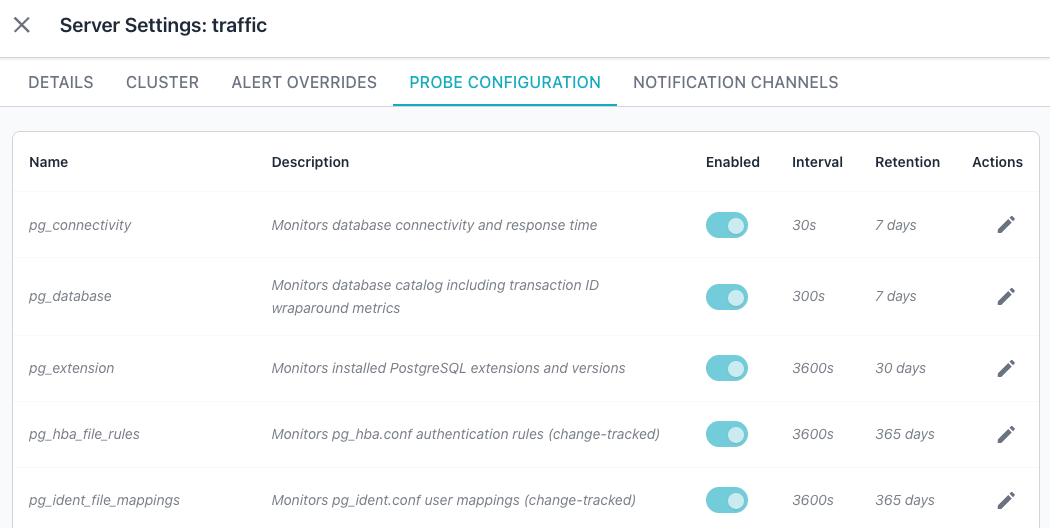
The PROBE CONFIGURATION tab controls the probes that collect metrics for the
selected server. A table lists the current probes and their settings; each row
describes one probe and its configuration. The table contains the following
columns:
Nameidentifies the probe.Descriptionexplains what the probe monitors.Enabledprovides a toggle that activates or deactivates the probe for the selected server.Intervalspecifies how often the probe collects data, in seconds.Retentionspecifies how long the Workbench retains the probe's collected data.Actionsprovides an edit (pencil) icon that opens the probe for adjustment.
The table scrolls to reveal additional probes below the visible rows. See Probe Management for the full list of built-in probes and their scopes.
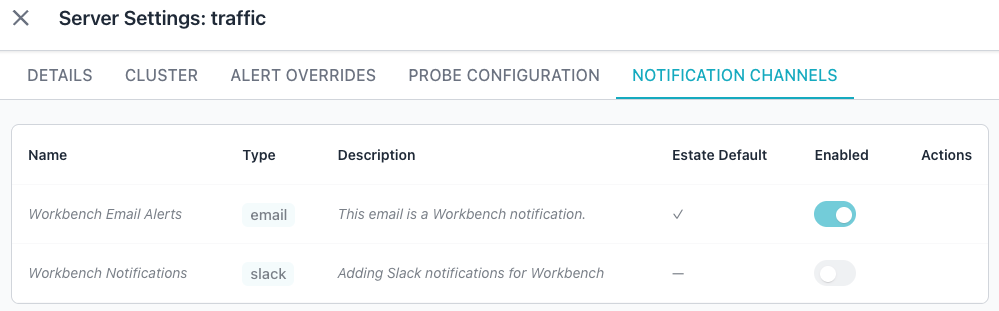
NOTIFICATION CHANNELS Tab
The NOTIFICATION CHANNELS tab manages the channels that deliver alert
notifications for the selected server. A table lists the available channels
and their settings; each row describes one channel and its current override
state. The table contains the following columns:
Nameidentifies the notification channel.Typeshows the channel type, such as email, Slack, Mattermost, or webhook.Descriptionshows the channel's optional description.Estate Defaultindicates whether the channel applies to all servers or clusters by default.Enabledprovides a toggle that activates or deactivates the channel for the selected server, overriding the estate default.Actionsprovides controls for managing the channel's override for the selected server.
If you have not configured any notification channels, the tab displays the empty state "No notification channels found." See Notification Channels for the full list of supported channel types and how to configure them.