Estate Dashboard
The ESTATE OVERVIEW presents a fleet-wide health assessment at a glance. To
view the ESTATE OVERVIEW, select the top-level estate node in the
cluster navigator.
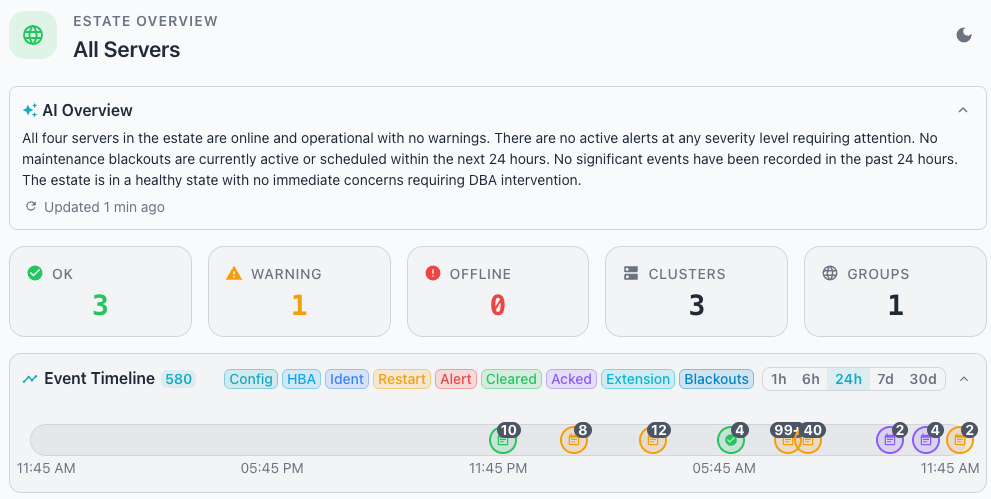
If you have configured AI for your Workbench, the ESTATE Overview displays
the AI Overview just below the header. The Overview provides
a concise, AI-powered summary of your database estate with notes about history
and recommended actions to maintain system health.

Tiles below the heading of the ESTATE OVERVIEW provide an at-a-glance overview of the state of your servers:

- The
OKtile (green) shows the count of servers that conform to all configured alert thresholds. - The
WARNINGtile (orange) shows the count of servers with one or more active threshold violations. - The
OFFLINEtile (red) shows the count of servers that the collector cannot reach. - The
CLUSTERStile shows the total number of clusters across the estate. - The
GROUPStile shows the total number of groups in the estate.
Below the status tiles, the Event Timeline displays a timeline with
indicators that show monitored events that have occurred across the monitored
servers. See Event Timeline for details about using
the time range selector, event type filters, and reviewing event details.
Tiles below the event timeline provide a quick glance into the performance of your selected estate, server, or cluster. Hover over a chart or graph to review detailed information about a specific point in time for the selected metric.
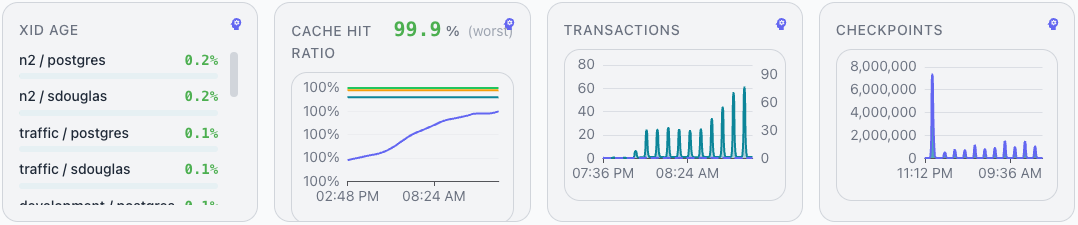
The section includes the following charts and graphs:
- The
XID Agechart lists database and user pairs with their XID age percentage, color-coded to indicate health. - The
Cache Hit Ratiograph displays a headline worst-case ratio and a line chart tracking the ratio across the selected time range. - The
Transactionsgraph displays a dual-line time-series chart showing commit and rollback activity across the estate. - The
Checkpointsgraph displays a chart showing checkpoint activity across the selected time range.
Reviewing Active Alerts
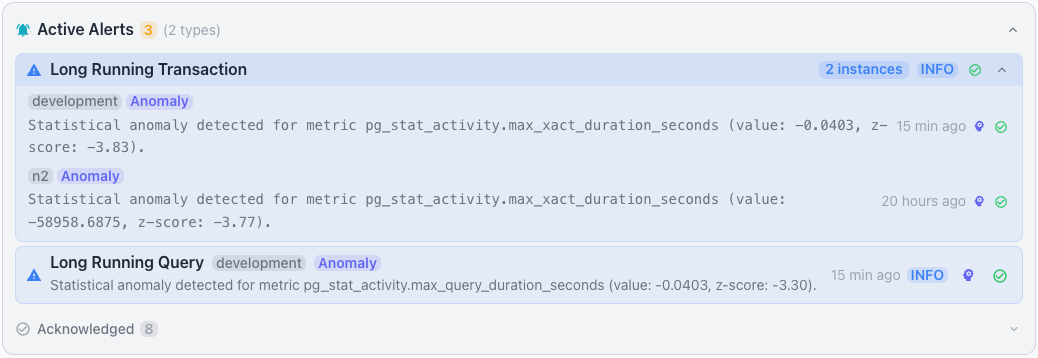
The Active Alerts pane shows the alerts that are currently active across the
estate.
Hint
If you've enabled AI in your cluster, you can use the Analyze with AI
icon located at the right of each alert icon to open an AI session with
Ellie that will help resolve the alert.
See Using Alerts for details on reviewing, acknowledging,
and analyzing alerts, and for how to find an alert's acknowledgment reason or a
past alert from the Event Timeline.
Monitoring Details of your Estate
Panes within the Monitoring panel present an overview of the estate. See
the Time Range Selector section for details
on rescoping data and expanding or collapsing panes.
Reviewing the Health Overview
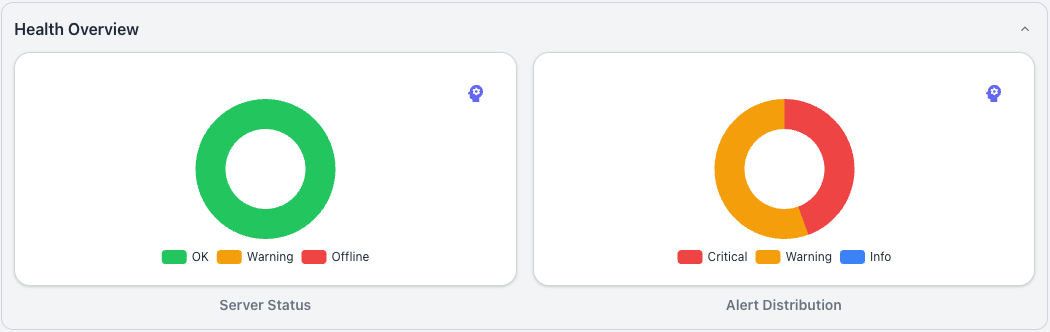
The Health Overview pane summarizes server status and alert distribution
across the estate. The left tile displays a donut chart labeled Server Status
that groups servers by health category. The chart legend identifies the
following categories:
- The
OKcategory appears in green. - The
Warningcategory appears in orange. - The
Offlinecategory appears in red.
The right tile displays an Alert Distribution chart that breaks down active
alerts. When no alerts are active, the panel displays No active alerts. The
brain icon in the top-right corner of the tile opens an
AI chart analysis of the
displayed data.
Reviewing Key Performance Indicators
The Key Performance Indicators pane displays four tiles that summarize
estate-wide metrics. Each tile presents a single aggregate value across all
monitored servers.
The pane includes the following tiles:
- The
TOTAL SERVERStile shows the total number of monitored servers across the estate. - The
TOTAL CONNECTIONStile shows the total number of active database connections across all servers. - The
TRANSACTION RATEtile shows the aggregate transactions per second (tx/s) across the estate. - The
ACTIVE ALERTStile shows the total number of currently active alerts across all servers.

Reviewing Clusters in your Estate
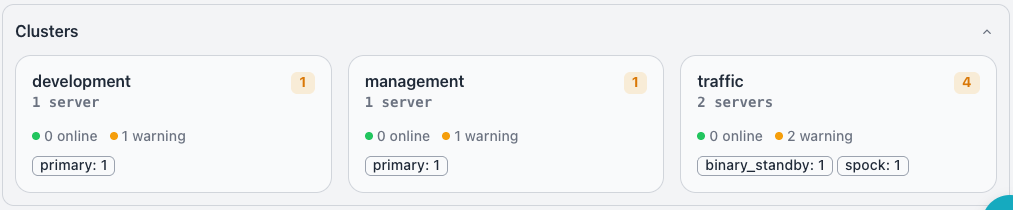
The Clusters pane displays one tile for each cluster in the estate. Click a
cluster tile to navigate to the cluster dashboard for that
cluster.
Each cluster tile displays the following details:
- The cluster name identifies the cluster; for example,
development,management, andtraffic. - The server count shows the number of servers in the cluster, such as
1 serveror2 servers. - Colored dots indicate the online and warning counts; a green dot marks online servers, and an orange dot marks servers in a warning state.
- Role tags display as chips that show each role and its count, such as
primary: 1,binary_standby: 1, andspock: 1. - An orange badge displays the active alert count when the cluster has active alerts.